import matplotlib.pyplot as plt
import numpy as np
import sympy as sp
from numpy.polynomial.chebyshev import chebfit, chebval


def clenshaw(x, coef):
    n = len(coef) - 1
    b1 = b2 = 0.0

    for k in range(n, 0, -1):
        b0 = coef[k] + 2.0 * x * b1 - b2
        b2 = b1
        b1 = b0

    return coef[0] + x * b1 - b2


def map_to_chebyshev_domain(x, a, b):
    return (2.0 * x - (a + b)) / (b - a)


def max_abs_error(ref, approx):
    return np.max(np.abs(ref - approx))


def make_taylor(var, f_expr, degree, x0=0.0):
    p_expr = f_expr.series(x=var, x0=x0, n=degree + 1).removeO()
    f_taylor = sp.lambdify(var, p_expr, "numpy")
    return p_expr, f_taylor


def fit_chebyshev(f, a, b, degree, num_fit_points=1000):
    xs = np.linspace(a, b, num_fit_points)
    t = map_to_chebyshev_domain(xs, a, b)
    return chebfit(t, f(xs), degree)


def approximate(
    var,
    f_expr,
    a=0.0,
    b=1.0,
    degree=4,
    x0=0.0,
    num_fit_points=1000,
    num_eval_points=1000,
):
    # evaluation points
    x = np.linspace(a, b, num_eval_points)

    f = sp.lambdify(var, f_expr, "numpy")
    y_ref = f(x)

    # Taylor
    p_expr, f_taylor = make_taylor(var, f_expr, degree, x0)
    y_taylor = f_taylor(x)

    # Chebyshev
    coef = fit_chebyshev(f, a, b, degree, num_fit_points)
    t = map_to_chebyshev_domain(x, a, b)
    y_cheb = chebval(t, coef)
    y_clenshaw = np.fromiter((clenshaw(ti, coef) for ti in t), dtype=np.float64)

    return {
        "a": a,
        "b": b,
        "degree": degree,
        "num_fit_points": num_fit_points,
        "num_eval_points": num_eval_points,
        "x": x,
        "p_expr": p_expr,
        "coef": coef,
        "y_ref": y_ref,
        "y_taylor": y_taylor,
        "y_cheb": y_cheb,
        "y_clenshaw": y_clenshaw,
    }


def evaluate_error(result):
    y_ref = result["y_ref"]

    result["err_taylor"] = max_abs_error(y_ref, result["y_taylor"])
    result["err_cheb"] = max_abs_error(y_ref, result["y_cheb"])
    result["err_clenshaw"] = max_abs_error(y_ref, result["y_clenshaw"])
    result["err_impl"] = max_abs_error(result["y_cheb"], result["y_clenshaw"])

    return result


def print_result(result):
    print(f"Interval     : [{result['a']}, {result['b']}]")
    print(f"Degree       : {result['degree']}")
    print(f"Fit samples  : {result['num_fit_points']}")
    print(f"Eval samples : {result['num_eval_points']}")
    print()
    print(f"Taylor approximation error    : {result['err_taylor']}")
    print(f"Chebyshev approximation error : {result['err_cheb']}")
    print(f"Clenshaw approximation error  : {result['err_clenshaw']}")
    print(f"chebval vs Clenshaw           : {result['err_impl']}")
    print(f"Taylor / Clenshaw error ratio : {result['err_taylor'] / result['err_clenshaw']}")
    print("\nChebyshev coefficients :")
    print(result["coef"])


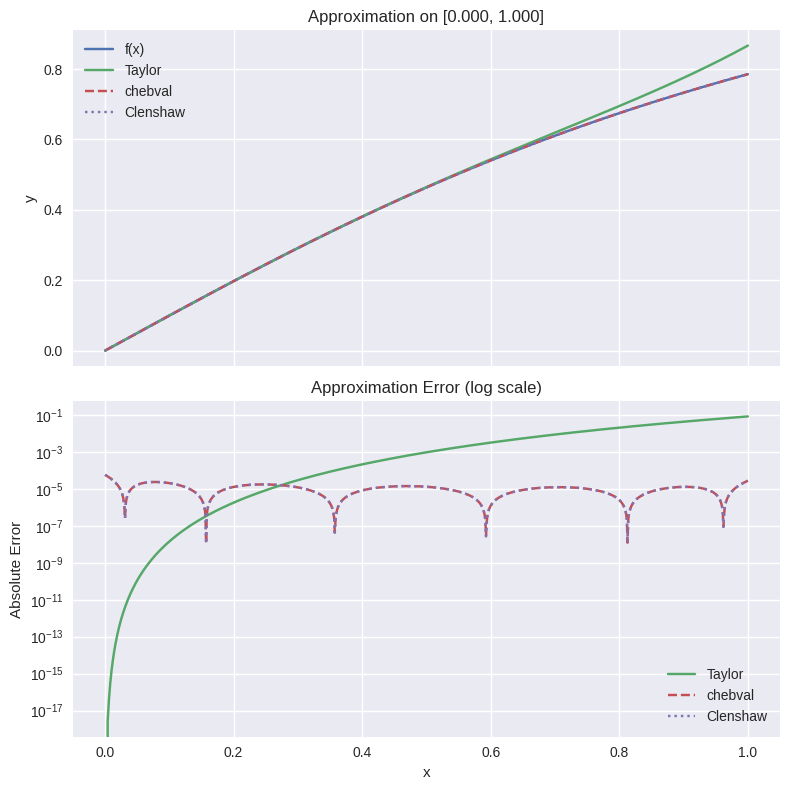
def plot_result(result):
    a = result["a"]
    b = result["b"]
    x = result["x"]
    y_ref = result["y_ref"]

    fig, ax = plt.subplots(2, 1, figsize=(8, 8), sharex=True)

    ax[0].plot(x, y_ref, label="f(x)")

    methods = [
        (result["y_taylor"], "-", "Taylor"),
        (result["y_cheb"], "--", "chebval"),
        (result["y_clenshaw"], ":", "Clenshaw"),
    ]

    for y, ls, label in methods:
        # Approximation
        (line,) = ax[0].plot(x, y, linestyle=ls, label=label)
        # Absolute error
        ax[1].semilogy(x, np.abs(y_ref - y), color=line.get_color(), linestyle=ls, label=label)

    ax[0].set_ylabel("y")
    ax[0].set_title(f"Approximation on [{a:.3f}, {b:.3f}]")
    ax[0].grid(True)
    ax[0].legend()

    ax[1].set_xlabel("x")
    ax[1].set_ylabel("Absolute Error")
    ax[1].set_title("Approximation Error (log scale)")
    ax[1].grid(True, which="both")
    ax[1].legend()

    plt.tight_layout()
    plt.show()


def degree_error(degrees, **approximate_kwargs):
    for degree in degrees:
        res = approximate(degree=degree, **approximate_kwargs)
        res = evaluate_error(res)

        yield (degree, res["err_taylor"], res["err_cheb"])


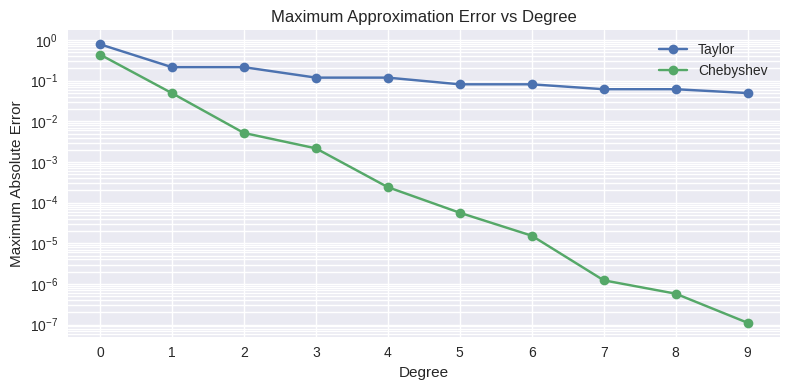
def plot_degree_error(ax, degrees, **approximate_kwargs):
    degrees_ = []
    errors_taylor = []
    errors_cheb = []

    for degree, err_taylor, err_cheb in degree_error(degrees, **approximate_kwargs):
        degrees_.append(degree)
        errors_taylor.append(err_taylor)
        errors_cheb.append(err_cheb)

    ax.semilogy(degrees_, errors_taylor, marker="o", label="Taylor")
    ax.semilogy(degrees_, errors_cheb, marker="o", label="Chebyshev")
    ax.set_xlabel("Degree")
    ax.set_ylabel("Maximum Absolute Error")
    ax.set_title("Maximum Approximation Error vs Degree")
    ax.set_xticks(degrees_)
    ax.grid(True, which="both")
    ax.legend()

    plt.tight_layout()
    plt.show()